


Envision Dashboard Apps -
Visualize your data
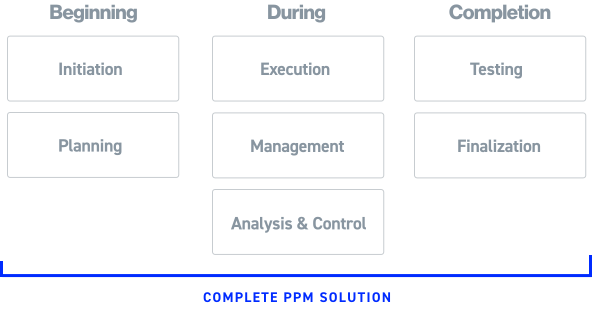
Easily create customizable dashboard applications without any coding requirements and gain new insights into your project from planning to testing and completion.
Project Intelligence
From start to finish
Revolutionize your data visualization and analysis across all project stages and domains with our comprehensive Proteus Envision Dashboard Applications.
Unlock the true potential of your data, from project initiation to completion.
A Library of pre-built apps.
We have a fine-tuned battle tested pre-built applications for every stage of your project.
We’ve split the Envision Dashboard Apps into 4 modules:
1
Project and Program Management
Now you can utilize data from legacy schemas including the DoD IPMR and IPMDAR to provide a comprehensive EVM, GEAC, and Schedule capability.
Included Applications
2
Risk Analysis
Apply risk analysis engines, and enables review and reporting of risk registers, schedule analysis, and Joint Confidence Level analysis.
Included Applications
3
Systems Engineering
Integrate elements of MBSE systems. Capture of data from engineering documents and processes including:
- Requirements management
- Regulations and standards,
- Safety and mission assurance,
- Technical performance management,
- Framing assumptions,
- Measures of effectiveness & performance,
- Key performance parameters/indices,
- Technical performance measures.
Included Applications
4
Portfolio, Contract, and Executive Management
From financial analysis and cashflow to facilitating portfolio and organizational overviews these applications are linked with non-traditional business intelligence information geared to higher levels of the customer organization
Included Applications
Easily build your own apps
Fine tune and customize any app in our library to your specific needs or build from scratch using our app designer.

Design your own apps and dashboards
Easily create customizable dashboards and gain valuable insights into your project from planning to testing and completion.
No Code Required
With a powerful object-oriented administrative layer that accesses data binding, integration, interoperability easily design your data visualizations with drag and drop.

Complex Data made Simple
Create real-time visualization and see changes live on your dashboard. Don’t want to build it yourself? We can help you build out your dashboard per your requirements.
Go from
3 Month
To
Dashboard Examples:

Aggregates sales data within interactive dashboard to show trending and comparison across products, categories and regions of revenue and units sold against targets. Clicking on state, graph component, card or grid record(s) dynamically updates and filters aggregated data..

Ties Geographic Information (GIS) to data, in this case train stations as a background overlay on the map and railway maintenance work as a foreground overlay with tooltips. This can easily be applied to roadways, environmental data sets and oil & gas to integrate any kind of data into a map.

Visually shows health, safety and environmental compliance via color coding on a bitmap schematic, in this case an oil rig platform. Clicking on that polygon on the image navigates the user to relevant data.

Integrate systems such as schedule data from an Integrated Master Schedule with external systems such as Enterprise Resource Planning (ERP), Quantifiable Backup Data (QBD), supplemental schedules and so forth. Drilling down into a task shows the related records from the external system.

Earned Value performance trending with industry defined metrics integrated with schedule, risk and other datasets utilizing the IPMR Formats and/or the IPMDAR Datasets.

Calculate and report out the DCMA Earned value Compliance Metrics (DECM)

Aggregate project performance data into portfolio’s by programs, contractors, directorates, mission capabilities and so forth.

Leverage the power of AI
Use the power of Artificial Intelligence to create a human readable report that summarizes all key points of your data and calls out important metrics.

Additional Features
White Label
Customize the branding and appearance of the dashboards to match your company brand identity.
Data Filtering
Filter data by specific field or meta data. Map fields directly from your data straight to your visualizations.
Automations
Set up automated tasks, notifications and coloring to be alerted if your preset conditions are met.
In Cloud or On Premises
Run locally on premises or scale Proteus Envision easily with our government compliant cloud by TBS.
Bad & Corrupt data detection
Detect bad or corrupted data based on the criteria that you specify. Quickly remove it without disruptions.
Compliance Failure Detection
See instantly when something fails compliance and act quickly.
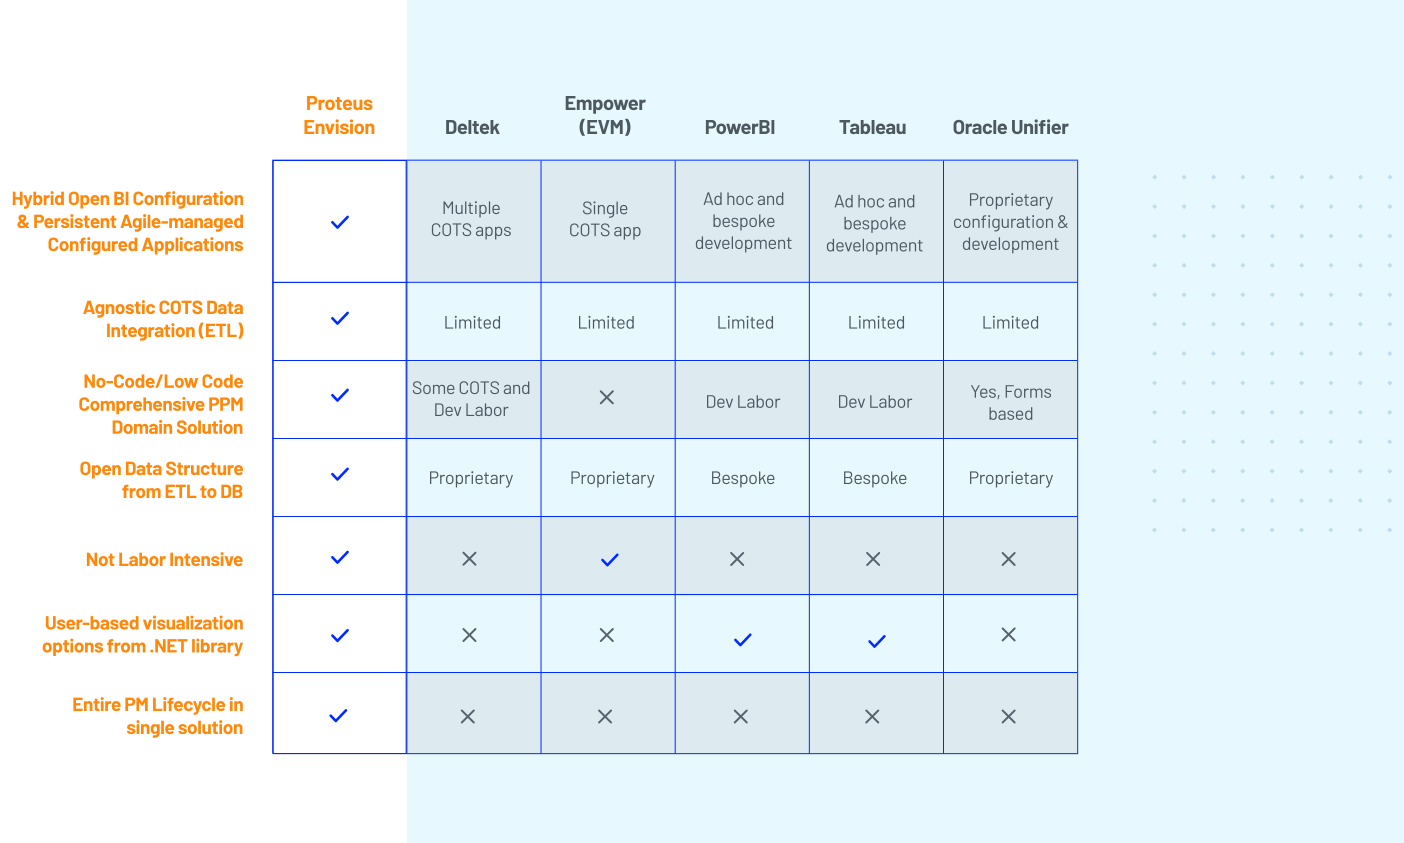
Proteus Envision vs Others
We provide an easily customizable solution right out of the box that utilizes OPEN transparent formats all within one solution. See how we compare to others.
Purchase Once, Use Forever
Say goodbye to recurring fees, Own your software with a single upfront cost. Get ongoing support and updates with our flexible maintenance plans, maximizing your investment and ensuring long-term value.
Want to see more?
Get in touch with one of our solutions experts for a demo and see how quickly we can unify your data
Learn How To:
Connect with us
Questions and Answers
Don’t see your question? get in touch.
Within a couple of hours, the Proteus client application can be installed, the database schema(s) created, repository folder(s) updated with your organization's specific connection parameters, users and groups defined and the first import of data ready for analysis.
The openness and ease to create and maintain Dashboard Apps with Proteus Integrator facilitates the development of so many turn key solution. This allows the solutions to be tailored for specific project management domains such as cost analysts, schedule analysts, earned value management analysts, systems engineering, risk management and so forth as well as the integration across those domains for a complete picture for project managers and executive management. From a single source of truth and platform, solutions can be fine-tailored for groups of users to support what they need to see for their job functions.
Yes, absolutely and that is encouraged. Proteus Integrator admins can modify the configurations for any Dashboard App that they have permission to do so in terms of sources of data, calculated fields and user interface controls, and those changes are immediately pushed out to the end users when the repository is published. They can also create new, or merge, Dashboard Apps as needed. The Proteus end users can further customize the views, layouts, dashboard, reports etc. centrally for the organization or just for their personal use.
Yes, often times the data loading into Dashboard Apps is internal to an organization in their enterprise databases or local files that external stakeholders and customers don’t have access to. Proteus has the ability to create a Container, which persists that live data with the configuration of the Dashboard App, that can be sent to other users as long as they have Proteus to open it and the access rights to view it. Ultimately, the receiver of the Container will see exactly what the user who created it in the live environment saw.